


Let’s talk today about time. Market Time. Also known as Days On Market.
It’s not uncommon to hear the media in their bad-real-estate-news reports to say, “Average Days on Market is climbing to new record highs.” Unfortunately, tracking “average” anything in the real estate market can be fraught with danger. What home is average? Are there other ways? Let’s explore.
1. Average (Mean) Days on Market VS.
2. Median Days on Market
Really, Mike, must I go through stats class? Yes. Yes you must. Because it matters to your clients. Think of it this way. Average, or mean, is like taking all the homes and mushing them together and distributing equally. For example, the average of five homes at 75, 95, 100, 120, and 360 days is 150 (750 divided by 5). Median on the other hand is simply the middle-est one. In this same group median days is 100. Both numbers describe the market, but that’s a big difference.
Got it? Good, you pass. Now let’s apply it to the real world. Look what’s happening in Frisco Texas.

Frisco, Texas Average vs. Median Days on Market. Single family homes. Source: Altos Research
Why is Average Days on Market so much higher than Median DoM? When you see this condition it means a lot to your clients: A hand-full of lousy, stale properties can skew the average higher. You know that dump that’s been for sale for two and a half years? That one really hurts the average. But the median shows you that half of the properties (the good half!) are moving much more reasonably. Starting to see a little improvement this spring, even.
And this is what your client needs to know, of course. “Everyone knows that the average DoM is climbing. [Duh!] But check this out. When you look at the median DoM, you can see that the good ones, the ones you happen to be in the market for, are turning over much more quickly. So, let’s not get stuck on the headlines, shall we?”
3. Illustrate By Price Range
Often the median and mean days on market are very close. So you’ll need to approach with a different scenario. Another good technique is to look at the market time for properties in the same price range as where your clients are buying or selling. To illustrate the trends within price ranges, at Altos Research we use a technique call Price Quartiles. Each quartile is a price band of 25% of the market. First quartile is the most expensive 25%, etc. By watching the quartile, you get a view of the market for similarly-priced homes.
You’d think that the high-end of the market would take longer to sell than the low-end. But this is not always true. When the low-end is slower, you can provide a compelling insight for your clients. Consider this chart for San Jose, California.
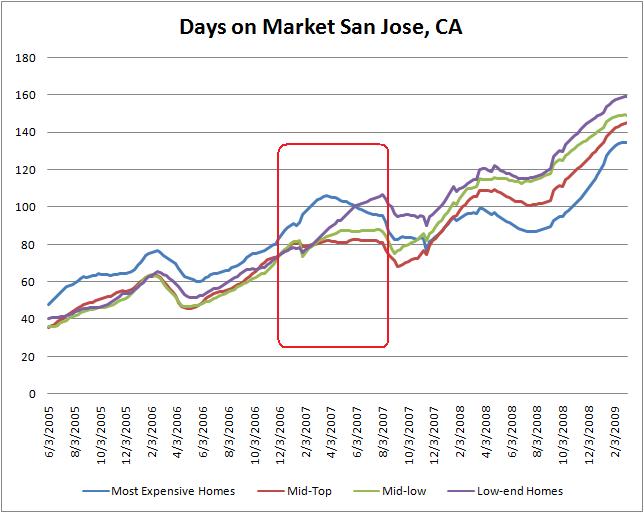
Days on Market Trend for single family homes in San Jose CA. By price range quartile. Notice how the sub-prime blowup in February 2007 immediately and dramatically shifts demand for entry-level homes. Source: Altos Research
The blue line is the highest-priced quartile, the most expensive homes ($1 million +) in San Jose. The purple line is the low-end. Notice the immediate, dramatic shift in demand that happened when the first sub-prime lenders started choking in early 2007. By 2008 only the most well-financed buyers were buying and that’s why the demand shows at the top of the market.
I often say that as a pro, you already know what’s happening in the market. Your job is to illustrate that knowledge to your clients. When talking market time, the nuances of which stat and which homes you measure can make a big difference in getting that message across.
Next week: derivatives


Russell Shaw
March 15, 2009 at 12:15 am
Excellent point regarding median DOM, Mike. I have never even thought about it that way. I’m going to take a new look at my stats with that in mind, so thank you!
Bill Remington
July 29, 2009 at 9:33 am
Great article. Tell me best way of determining mean
DOM for a town or subdivision by price range within a market? Do CMA and then what?
Thanks you,
Bill